
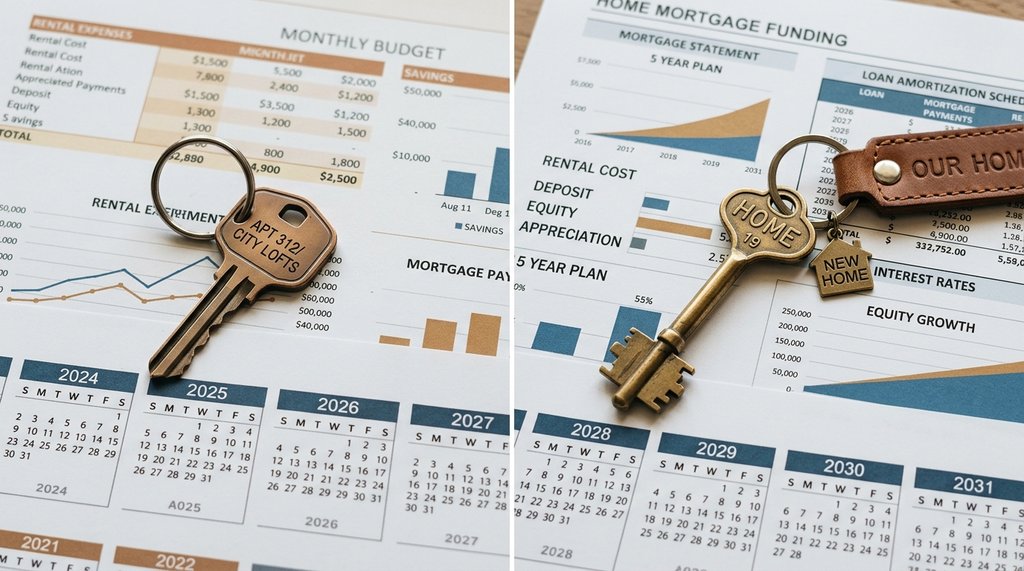
The Hidden Break-Even Timeline Before Buying Makes Sense
Buying a home feels like the obvious long-term move, but the number of years you actually need to stay put to come out ahead might surprise you.
Why the Break-Even Point Gets Ignored
Most people frame the rent-vs-buy decision as a monthly payment comparison. If the mortgage payment is close to the rent, buying seems like a no-brainer. But that framing skips an enormous upfront cost: closing costs, which typically run 2% to 5% of the purchase price.
On a $420,000 home, that's $8,400 to $21,000 paid before you make a single mortgage payment. That money doesn't build equity. It evaporates on day one. Until your home's appreciation and equity gains offset that loss, you're actually behind the renter financially, even if your monthly payment looks comparable.
What a 6.8% Rate Does to Your Break-Even Math
With 30-year fixed rates still sitting in the mid-to-upper 6% range, a large portion of early mortgage payments goes straight to interest, not equity. On a $336,000 loan at 6.8%, your first monthly payment of roughly $2,196 includes about $1,904 in interest and only $292 in principal. You're building equity very slowly at first. Try the rent vs buy calculator to see your own numbers.
Run the numbers on a $420,000 purchase with 20% down: after one year, you've paid down roughly $3,600 in principal. But you spent $8,400 to $21,000 closing. Add property taxes, insurance, and maintenance averaging 1.5% of home value annually, and your break-even point against a renter in the same area stretches to five, seven, or even nine years depending on local appreciation rates.
That timeline matters enormously. The national median homeowner tenure is just over eight years. Some buyers cut it much shorter due to job changes, family shifts, or life events. Buying and selling within four years in a moderate-appreciation market is a reliable way to lose money compared to renting.
Running Your Own Scenario in 10 Minutes
The variables that move the break-even line the most are home price appreciation, local rent growth, and how long you plan to stay. A city with 4% annual appreciation produces a very different answer than one growing at 1.5%. You need to plug in realistic local numbers, not national averages.
A rent vs buy calculator lets you adjust purchase price, down payment, interest rate, expected appreciation, rent growth, and holding period all in one place. The output shows you the exact year your net worth as a buyer overtakes your net worth as a renter. For many scenarios right now, that crossover arrives later than people expect.
Once you see the crossover year on a chart, the decision becomes much more concrete. If you're confident you'll stay 10 years, buying looks reasonable in most markets. If there's a real chance you relocate in four, the calculator will show you're likely better off renting and investing the down payment instead.
The One Number Worth Pinning Down Before You Decide
Before you tour a single open house, settle on your realistic holding period. Not the optimistic one, the honest one. Factor in your career trajectory, whether remote work is permanent or fragile, your family plans, and your city's job market. This single input shapes every other part of the analysis.
If you cannot confidently answer 'I will stay at least seven years,' the current rate environment makes renting the lower-risk choice in most mid-sized metros. That's not a pessimistic take on homeownership. It's just what the math shows when you stop comparing monthly payments and start comparing total wealth outcomes.