
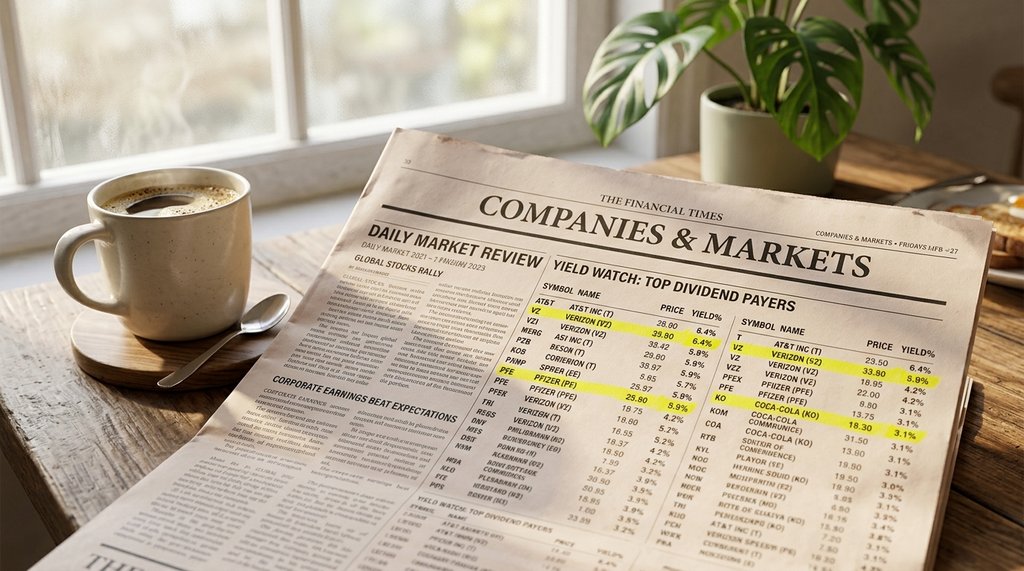
High Dividend Yield Looks Great Until You Do the Math
A 9% dividend yield sounds like free money, but sometimes it's the market telling you something is very wrong with a stock.
Why a Rising Yield Is Not Always Good News
Dividend yield is calculated by dividing the annual dividend per share by the current stock price. That means yield moves in two directions: it rises when the company raises its payout, and it also rises when the stock price drops. Many investors only notice the first case and miss the second entirely.
A stock paying $2 per share annually looks great at $40 a share, giving you a 5% yield. But if the price has fallen to $22 because the business is struggling, that same $2 dividend suddenly shows up as a 9% yield. Screeners flag it as a top income pick. In reality, the dividend is probably next on the chopping block.
The Fed Backdrop That Makes Yield Traps More Dangerous Right Now
With the Federal Reserve having kept benchmark rates elevated through much of 2025 and 2026, short-term Treasury yields are still competitive. A six-month T-bill is paying somewhere in the 4.5 to 5% range as of mid-September, with essentially zero credit risk. That changes the math on what counts as a fair equity yield. Try the dividend yield calculator to see your own numbers.
When risk-free alternatives pay 4.5%, a stock yield of 6% offers only a modest premium for taking on equity risk, potential dividend cuts, and tax complexity. Historically, investors demanded a much smaller equity yield because they had nowhere better to park cash. That calculus has shifted, and stocks with mediocre fundamentals propped up by a temporarily high yield deserve extra scrutiny.
Three Numbers to Check Before Trusting Any Yield Figure
First, look at the payout ratio: what percentage of earnings is the company paying out as dividends. A ratio above 80% in a cyclical industry is a red flag. Second, check free cash flow, not just earnings. Companies can report positive net income while burning through cash, and dividends are paid in cash. Third, look at whether the yield has spiked recently without a dividend increase announcement. That spike almost always means the stock price fell.
Run the dividend yield calculator to get the baseline number quickly, then use that figure as a starting point for the deeper checks above, not a finish line. A 7% yield that came from a 30% price decline in the past six months is a very different investment from a 7% yield built up over years of consistent dividend growth.
A Quick Scenario: Yield Trap vs. Genuine Income Stock
Take two hypothetical utilities. Company A pays $3.60 annually per share on a stock trading at $48, giving a 7.5% yield. Its payout ratio is 95% and free cash flow barely covers the dividend. Company B pays $2.80 on a $40 stock, also a 7% yield, with a 65% payout ratio and free cash flow 1.4 times the dividend. Company A looks better on a screener. Company B is the safer income investment by almost any measure.
The raw yield number hides all of that context. Spending two minutes with a dividend yield calculator to confirm the math is step one. Spending ten more minutes on the payout ratio and cash flow statement is what separates an income investor from someone who gets surprised when the quarterly payment gets cut in half.