
Does Dollar Cost Averaging Still Work in a Flat Market?
A year of sideways price action has investors questioning whether steady monthly contributions are worth the effort, and the math gives a surprisingly clear answer.
Why Flat Markets Frustrate Investors More Than Crashes Do
After the sharp equity rebound of late 2024 and early 2025, major indexes have spent most of this year grinding sideways. The S&P 500 is roughly where it was fourteen months ago. That kind of stagnation does something psychologically brutal: it makes disciplined investing feel pointless.
Crashes at least tell a clean story. Prices drop, you buy cheap, prices recover, you look smart. A flat market offers none of that narrative satisfaction. But the absence of drama does not mean the absence of return, and that is exactly where most people's instincts lead them astray.
What the Numbers Actually Show in a Sideways Price Trend
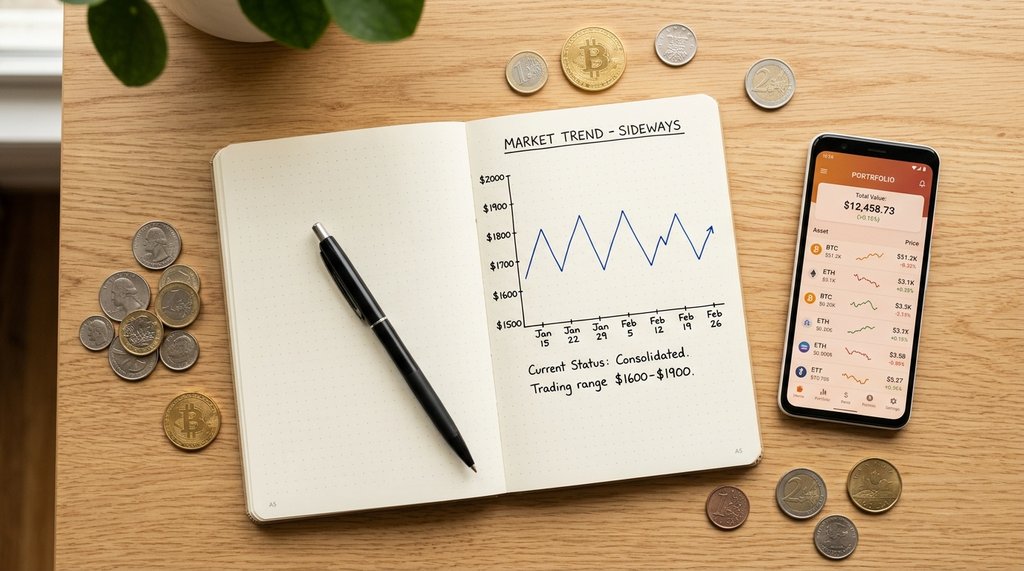
Take a simple scenario. You invest 500 dollars a month into an ETF that opens January at 100 dollars per share and closes December at 100 dollars per share, but oscillates between 88 and 112 along the way. Your total outlay is 6,000 dollars. Because you buy more shares when the price dips to 90 and fewer when it spikes to 110, your average cost per share lands somewhere around 97 dollars, not 100. Try the dollar cost averaging calculator to see your own numbers.
That 3-dollar gap per share is not dramatic, but across 62 shares purchased it represents roughly 186 dollars of embedded gain even though the asset price went nowhere for a full year. Annualized on a 6,000-dollar investment, that is a 3.1 percent return from volatility alone, before any dividend yield is counted.
Running those numbers by hand is tedious. A dollar cost averaging calculator lets you plug in your monthly contribution, an estimated price range, and a time horizon, then shows your projected average cost and total share count in seconds. It makes the invisible math visible.
The Misconception That Volatility Is the Enemy Here
Most investors treat price swings as a threat to be endured. For a lump-sum investor that framing is reasonable. For a regular contributor, moderate volatility is actually the engine of the strategy. The wider the oscillation around a flat mean, the lower your average purchase price relative to that mean.
This flips the usual anxiety. A perfectly smooth, slowly rising market is actually a worse environment for DCA than a choppy one at the same average price level. You never get to buy the dips if there are no dips to buy.
The caveat is a sustained downtrend with no recovery. If prices fall steadily and never bounce, DCA accumulates cheap shares that stay cheap. That is why DCA works best paired with diversified, broadly held assets rather than single stocks that can simply go to zero.
How to Set a Realistic Contribution Amount Right Now
With the Federal Reserve holding its benchmark rate in the 4.25 to 4.5 percent range through most of this year, high-yield savings accounts and short-term Treasuries are still paying meaningful real returns. That competition matters when deciding how much cash to redirect toward equities each month.
A reasonable starting point is to cover your emergency fund and any near-term spending needs in those higher-yield cash equivalents, then commit whatever remains to your DCA plan. Even 200 dollars a month invested consistently over a decade builds a position that lump-sum attempts often miss because life always seems to offer a reason to wait.
Before you finalize a number, run it through the scenario. Change the monthly amount, adjust the assumed average annual return between 5 and 8 percent, and see how the ending portfolio value shifts. Small changes in contribution size compound into very large differences at the 10 and 20-year marks.